

How to read your excluded-paper analytics
The Analytics tab of Excluded Papers totals the exclusion record: how many papers were removed, how each removal was decided, and which criteria and tags carried the most exclusions. It reads the same recorded decisions as the Papers List, so nothing here is estimated or re-entered — if a reviewer selected a reason while excluding, it’s counted.
What the tab counts
Section titled “What the tab counts”On the Excluded Papers page, switch to the Analytics tab. Two tiles set the scale:
- Total Excluded — papers removed during screening.
- Exclusion Criteria — how many distinct criteria appear on those papers, with N criteria selections recorded beneath it.
The two count different things: papers and selections. One paper is often excluded for several reasons, so the selections figure normally runs higher than the paper count — that’s the record being thorough, not double-counting.

How each exclusion was decided
Section titled “How each exclusion was decided”The Decision Methods card splits the excluded set three ways, each with its count and a share bar:
- Unanimous — every reviewer assigned to the paper voted to exclude.
- Majority Vote — the exclusion votes cleared the project’s threshold, which the card states (for example ≥67%); set in threshold settings. This only applies at three or more reviews per paper — at two, the meter is grayed out and reads N/A with 2 reviewers, because a two-reviewer split is a conflict, not a majority.
- Manual Resolution — the reviewers disagreed and the exclusion was settled by hand in the conflict workspace.
A large Manual Resolution share is the same signal as a high conflict rate on the screening overview: some criterion is being read two ways, and its definition is worth tightening.

Which criteria removed the most papers
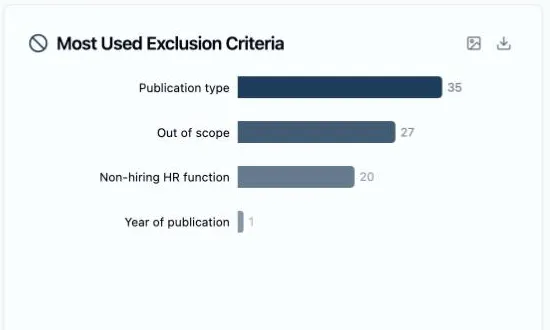
Section titled “Which criteria removed the most papers”Most Used Exclusion Criteria ranks your exclusion criteria as horizontal bars — one per criterion, longest on top, the paper count at the end of each bar. Hover a bar for the exact figures: Papers and % of excluded. This chart is the PRISMA “reasons for exclusion” answer at a glance: which reasons did the work, and in what proportion.
Which tags were cited most
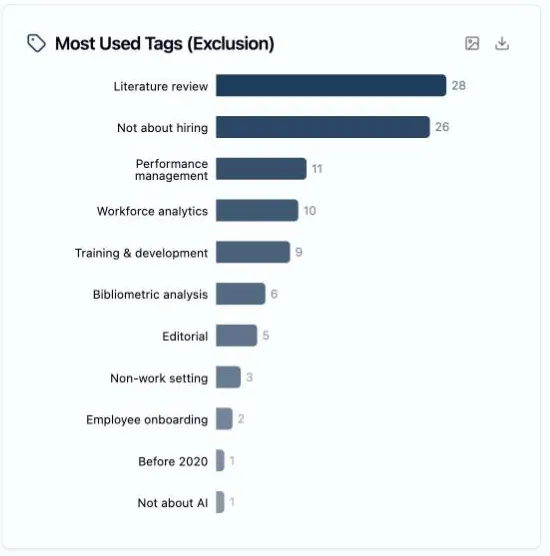
Section titled “Which tags were cited most”Most Used Tags (Exclusion) goes one level finer. Tags are the specific items under each category in the Criteria Builder — the pills reviewers actually click while screening. Where the criteria chart says a Publication type criterion removed the most papers, the tags chart says which publication types were cited — Literature review far ahead of Bibliometric analysis and Editorial. Hover a bar for Uses and % of all uses.
Take a chart with you
Section titled “Take a chart with you”Each chart card has two small icon buttons in its header: Export as PNG and Export as CSV. The PNG is the chart on a white background, ready for a slide or a supplementary figure. The CSV is the ranked table behind it — Rank, Criterion, Papers, Percentage for the criteria chart; Rank, Tag, Uses, Percentage for the tags chart — ready to paste into a manuscript.
These exports are the totals. For the paper-level detail — which papers each reason removed — go back to the Papers List tab and its CSV export, which lists every excluded paper with its method and reasons.
Next: How to generate your PRISMA flow diagram — where these counts take their place in the flow.