

Generate a PRISMA flow diagram online
Littview draws your PRISMA 2020 flow diagram for you, every box already filled from the project itself — what you imported, the duplicates you resolved, and the screening decisions your reviewers recorded, criteria and all. Your job on this page is to name the databases you searched, check the numbers, and export the figure.
Open the diagram
Section titled “Open the diagram”In the project sidebar under PRISMA, click PRISMA diagram. The page is headed PRISMA Diagram and renders the finished figure straight away, with Edit sources on the left of the button row and Export SVG, Export PNG, Export DOCX, and Refresh on the right. If you change something elsewhere — resolve another duplicate, settle a conflict — click Refresh and the figure redraws with the current counts.
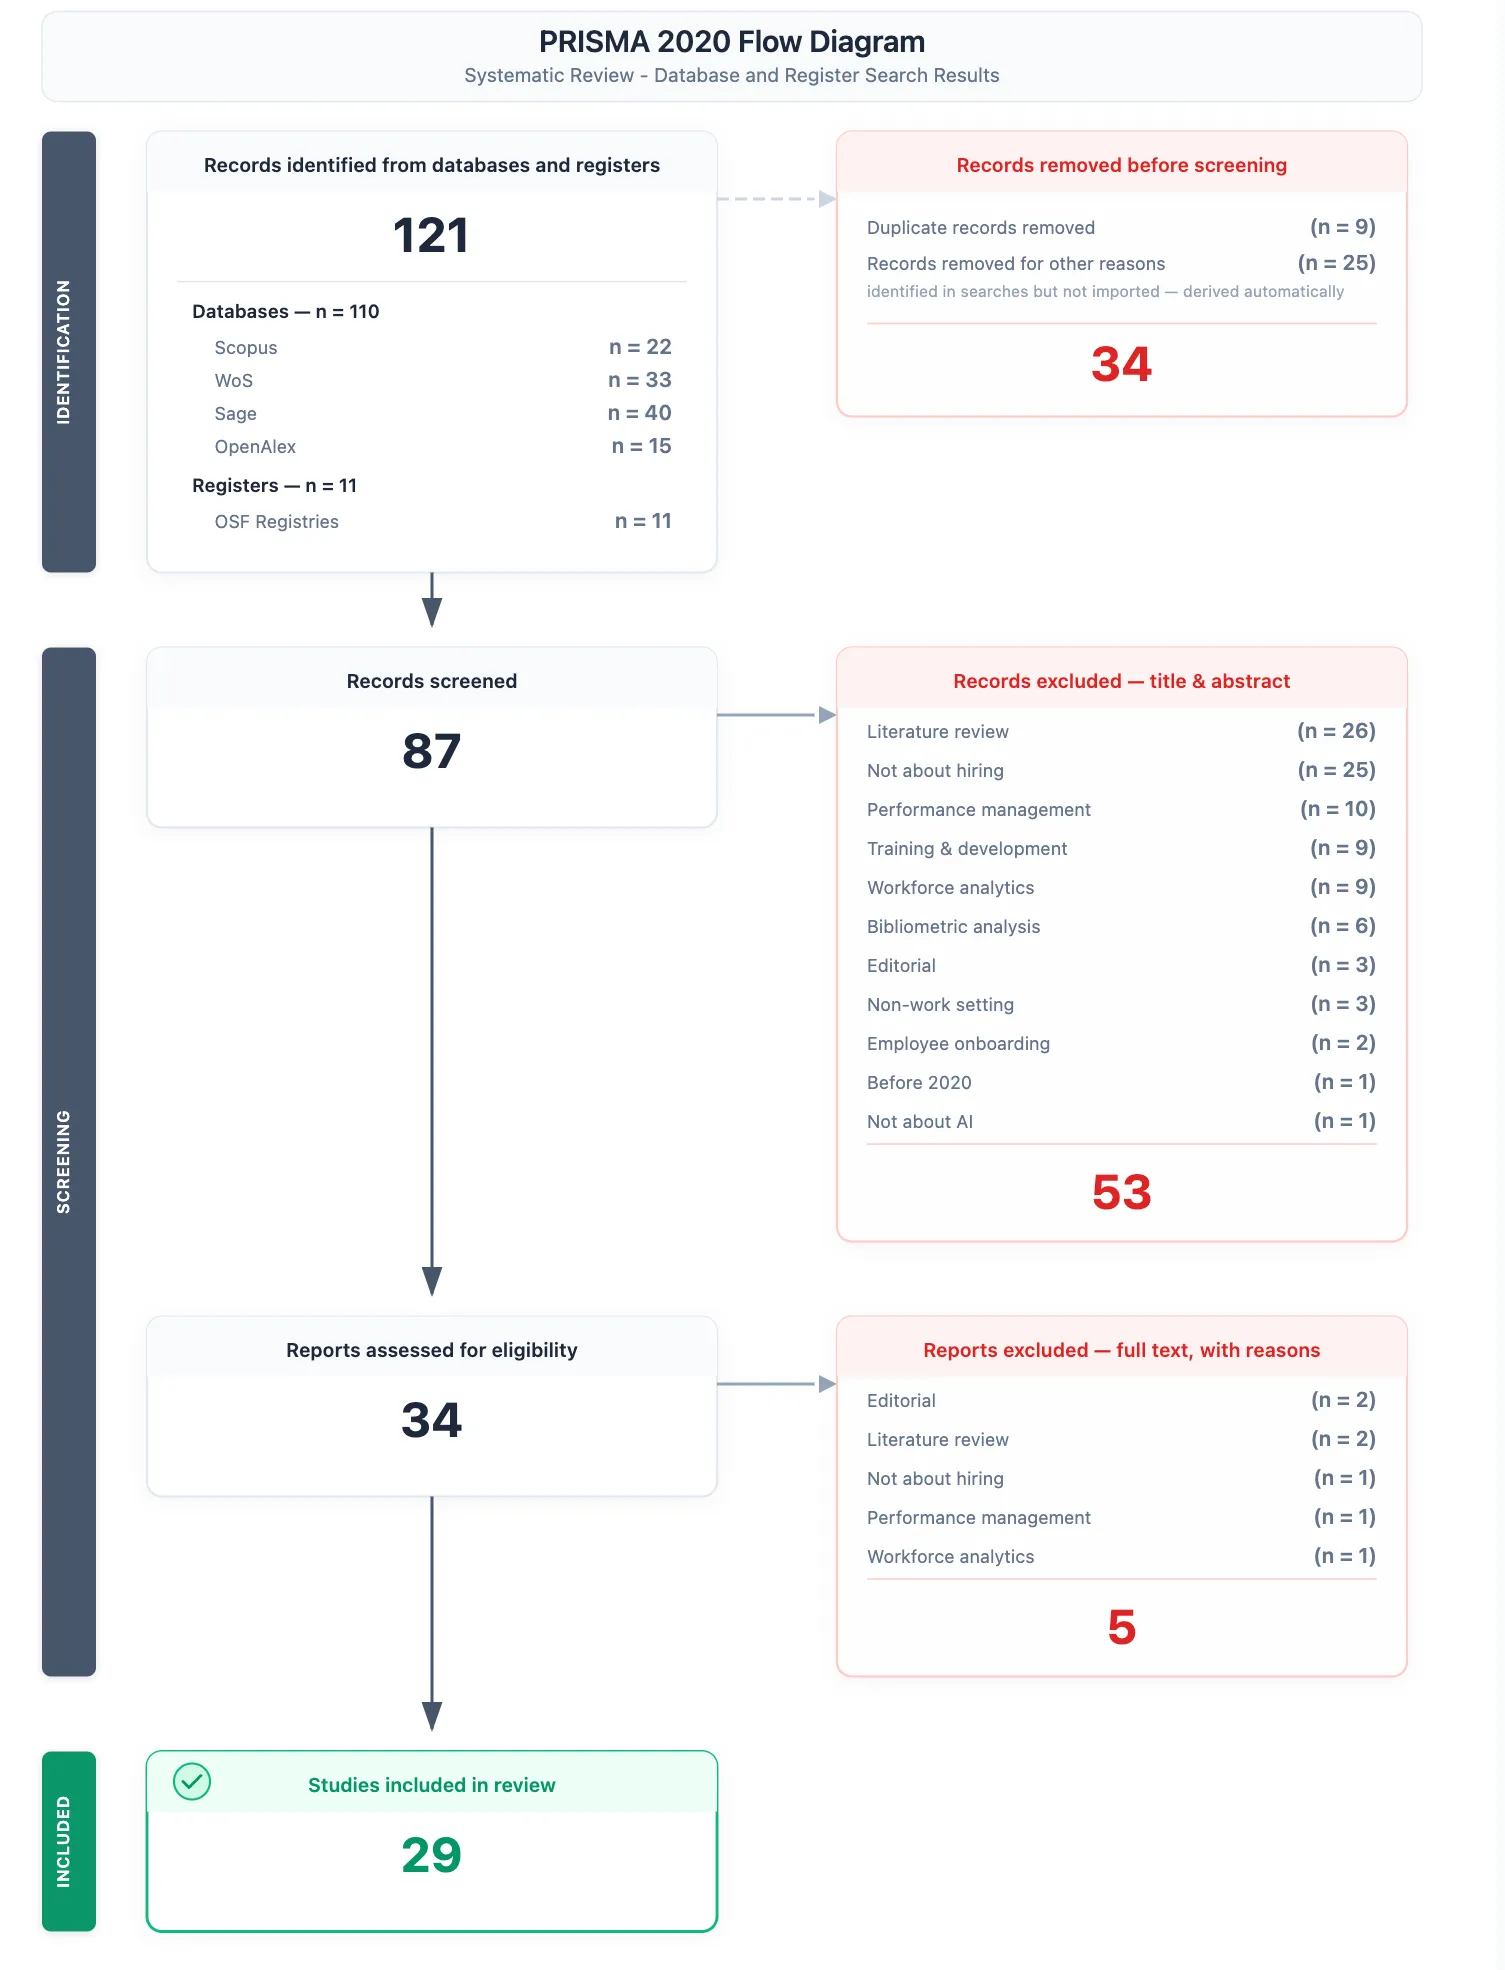
The figure runs down the left in the three PRISMA 2020 bands: IDENTIFICATION, SCREENING, INCLUDED. Records leave the flow to the right at each stage. The full-text row sits inside the SCREENING band rather than in a band of its own, because screening in Littview is one pass — more on that below.
How the flow adds up
Section titled “How the flow adds up”Every box in the left column equals the box above it minus the labeled exit to its right. That is the whole diagram, and you can check the arithmetic by eye — mid-review, the dashed box below carries the difference:
- Records identified from databases − Records removed before screening = Records screened
- Records screened − Records excluded — title & abstract = Reports assessed for eligibility
- Reports assessed for eligibility − Reports excluded — full text, with reasons = Studies included in review
Each of those numbers comes from work already done in the project:
- Records identified from databases — every reference imported into the project, across all its libraries. Once you name your search sources it reports their combined total instead, itemized by database.
- Records removed before screening — the references you resolved as duplicates in duplicate detection, shown on a Duplicate records removed line.
- Records screened — the records that reached a final screening outcome: every assigned reviewer decided and they agreed past the project’s threshold, or the disagreement was settled in conflict resolution.
- Reports assessed for eligibility — everything that got past title and abstract: the studies you included plus the reports you excluded at full text.
- Studies included in review — the same set the Included papers page lists.
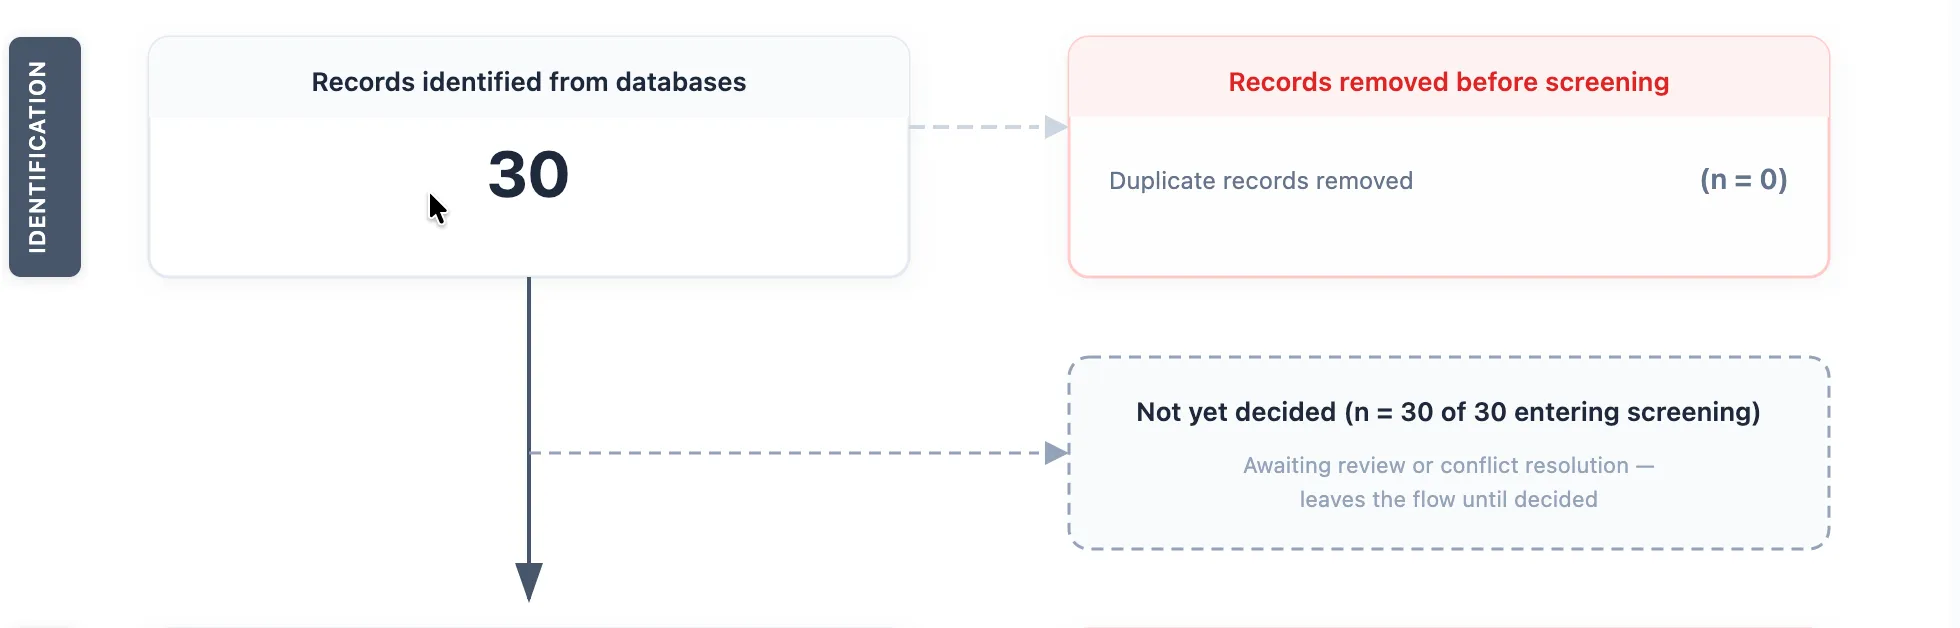
While the review is still running, a dashed box labeled Not yet decided (n = X of Y entering screening) branches off between identification and screening, subtitled “Awaiting review or conflict resolution — leaves the flow until decided”. Those records are the difference between what entered screening and what the Records screened box counts — papers still queued with a reviewer, or sitting in an unresolved conflict. The dashed box renders in the app and in all three exports, so a mid-review figure can never pass as a final one, and it disappears the moment the last record is decided.
The two exclusion boxes
Section titled “The two exclusion boxes”PRISMA reports exclusions in two places, and Littview splits yours by whether the paper had a full text on file when it was decided. The diagram states the rule in its own footnote:
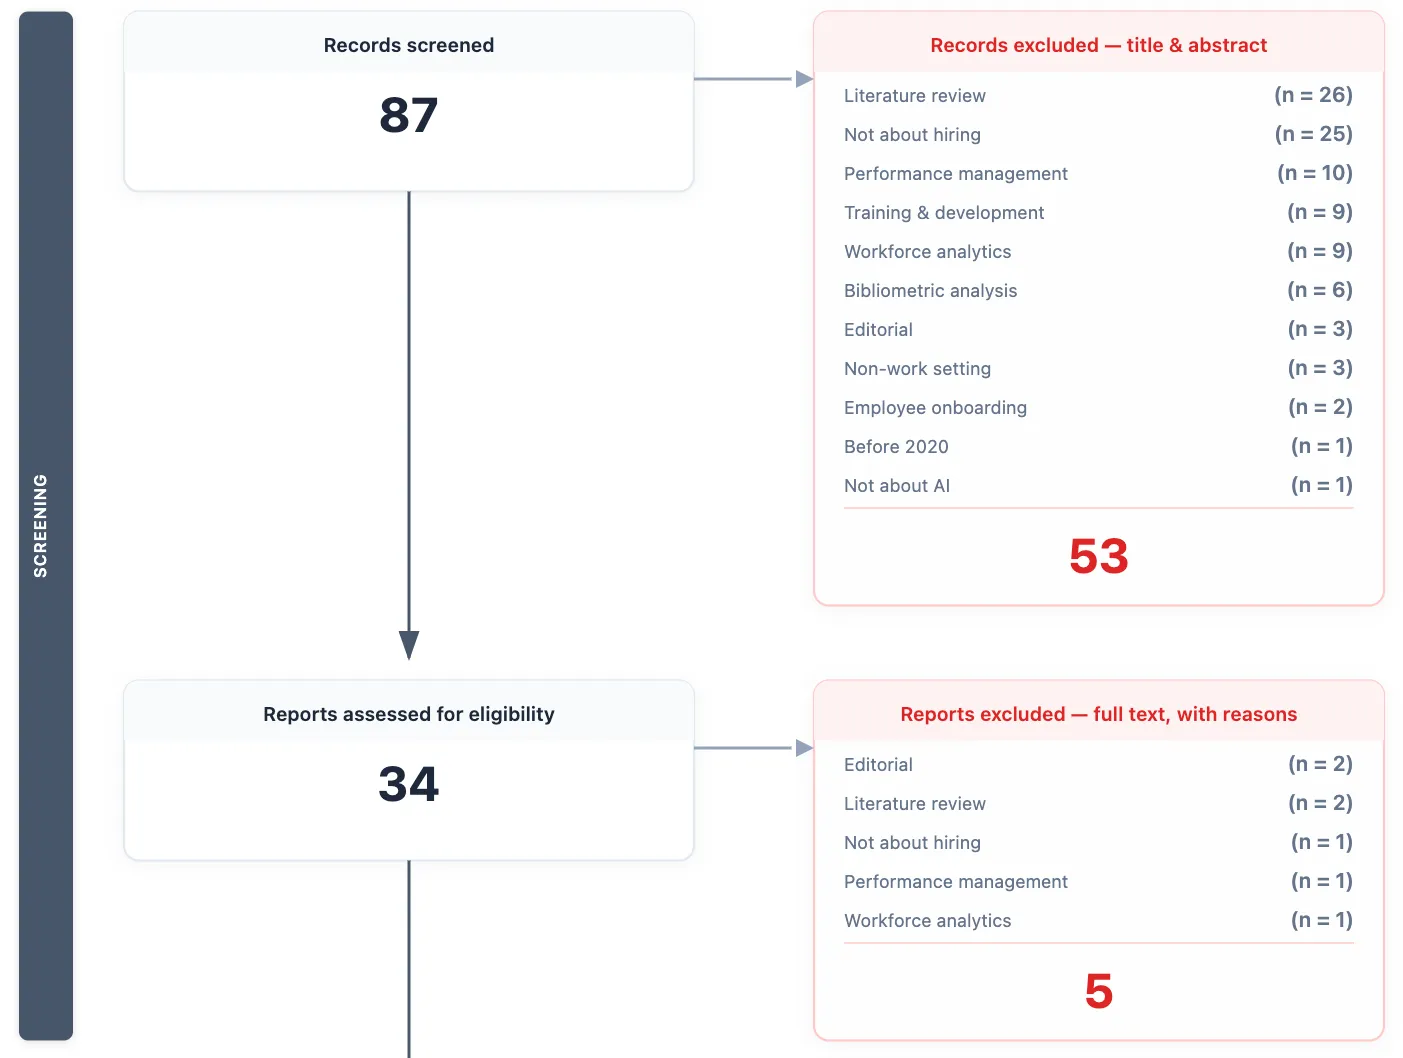
* Screening in Littview is a single phase: title/abstract and full-text assessment can happen in the same pass. Records excluded without a full text on file are reported as title/abstract exclusions; reports excluded with a full text on file are reported as full-text exclusions.
So Records excluded — title & abstract holds the papers your reviewers ruled out on the abstract alone, and Reports excluded — full text, with reasons holds those they ruled out with the PDF in front of them. Attaching a PDF is what moves a paper to the second box — the diagram’s second footnote says as much: “* Full-text counts reflect reports with a PDF attached in Littview at the time of export.”
Both boxes itemize the reasons PRISMA asks you to report, and nobody typed them here: each line is a tag your reviewers actually selected on an exclusion category while screening, with (n = X) counting the papers it removed, largest first. Because a reviewer can select several tags on one exclusion, the per-reason counts can add up to more than the box total — the diagram footnotes that too: “* Papers may appear under multiple exclusion reasons.”
If a box reads No exclusion reasons recorded, the totals are still right, but your reviewers excluded without selecting tags: the reason breakdown only exists where reviewers pick the exclusion tags that apply as they decide.
If no screened paper has a PDF attached, the diagram renders as an abstract-only review instead: no assessed row, no full-text exit, and the single exclusion box is labeled plain Records excluded with all of the reasons in it.
Name the databases and registers you searched
Section titled “Name the databases and registers you searched”PRISMA asks for the number of records found in each database or register, and only you know which ones you searched. Click Edit sources to open the Identification sources dialog and type them in: a Source name, a Type of Database or Register, and the Records that search returned. Add source adds a row, up to twenty.
Littview does not guess these from your uploads, on purpose. A library file is not a database — several uploads can come from one search, and one search can be split across several files — so file names are never presented as source names. Nothing appears on the diagram until you save the list yourself.
The dialog keeps a running summary under the rows: your identified total, the records imported into Littview, and what the difference will do. The total has to cover the imported count, and any excess is reported honestly rather than hidden — it becomes a Records removed for other reasons line in the Records removed before screening box, marked “identified in searches but not imported — derived automatically”.
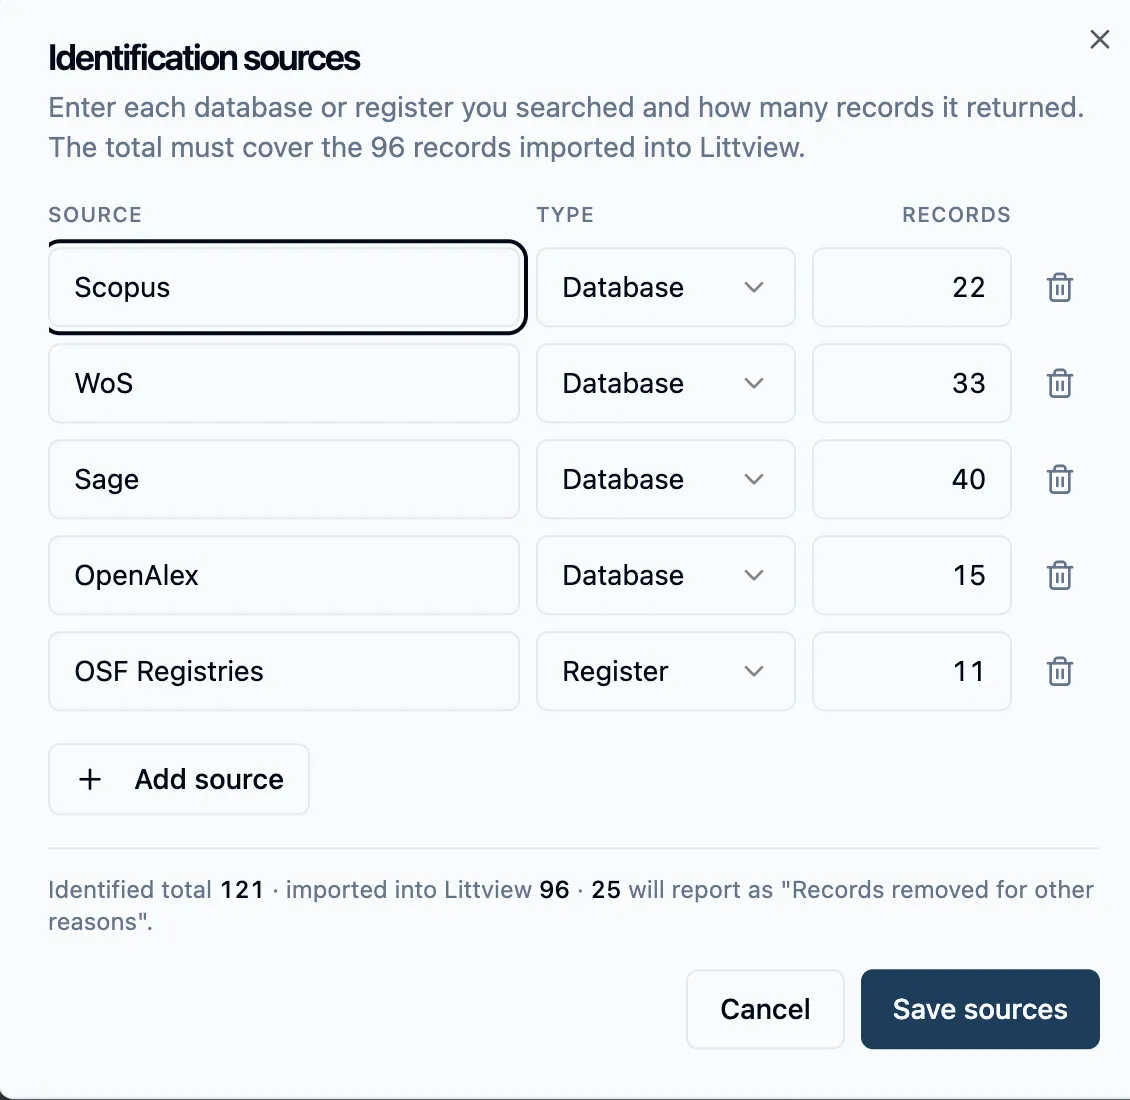
Save, and the top box lists every source with its own record count, under the title that matches your list — Records identified from databases and registers when you entered both kinds, Records identified from registers when you only searched registers. With both kinds in the list, the sources are grouped under bold Databases — n = X and Registers — n = Y headers. The footnote nudging you to report each source separately drops away, because now the figure does.
Two things worth knowing:
- To go back to a single total, remove every row and click Clear sources. The diagram returns to reporting the imported count only.
- If you import more records later and the saved total no longer covers them, the diagram quietly falls back to that total-only box until you update the list — it will not show a funnel that no longer balances.
Export the figure
Section titled “Export the figure”The three export buttons each download a file named prisma-2020-flow-diagram-<date>, always in the diagram’s light palette regardless of your app theme — ready for a manuscript:
- Export SVG — a vector file that scales to any size without blurring; the one to hand a journal that asks for vector figures.
- Export PNG — an image at twice the on-screen resolution, for slides or a submission portal that wants a bitmap.
- Export DOCX — an editable Word document, headed with the standard PRISMA banner Identification of studies via databases and registers. This is not a picture pasted onto a page: the diagram is rebuilt from native Word text boxes on a single US-letter page, so every label and count can be edited in Word before submission.
Word pages are finite, so a long list ends with a +N more reasons (or +N more sources) line and the export adds a second page carrying the complete lists as tables — All Identification Sources, All Exclusion Reasons — Title/Abstract Screening (just All Exclusion Reasons — Screening in an abstract-only review), and All Exclusion Reasons — Full-Text Assessment. Nothing your reviewers recorded is dropped.
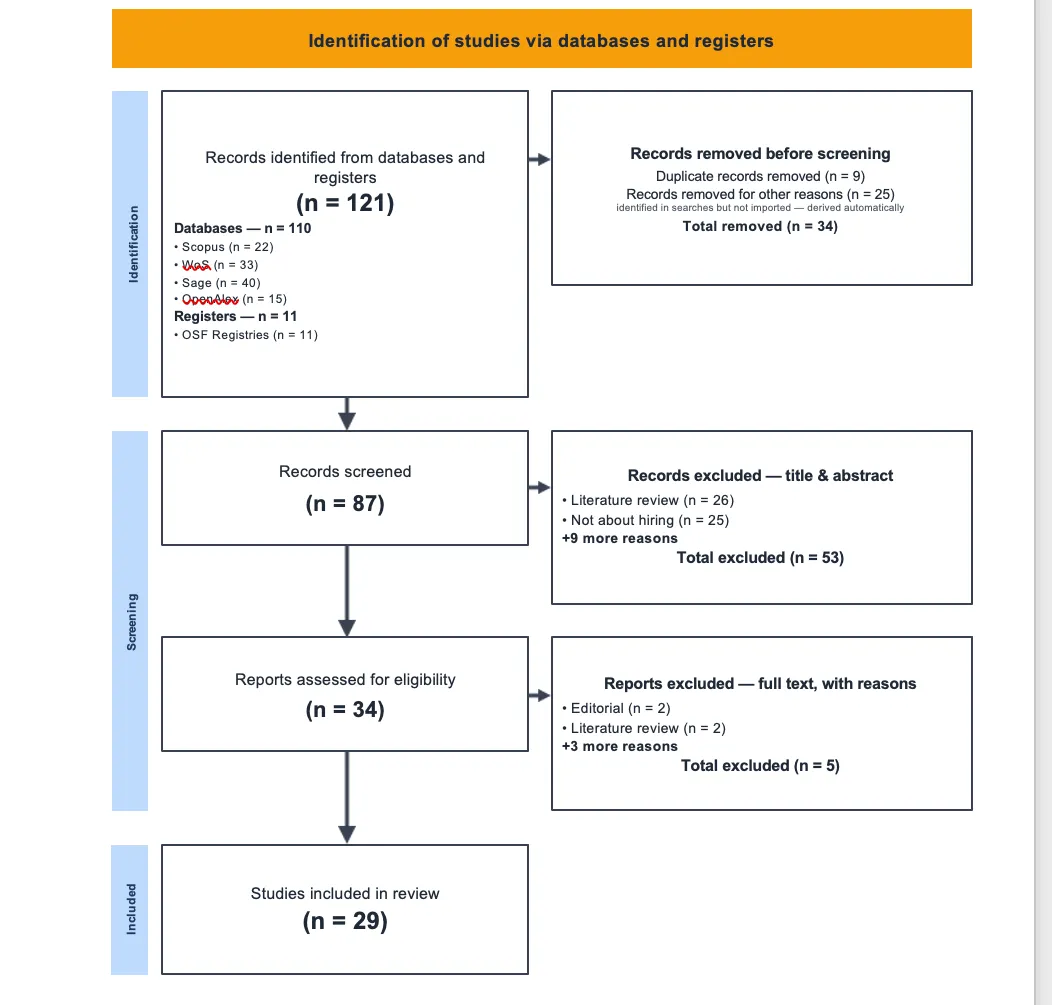
These are the same flow counts the Methods section draft describes in prose — check them once here, and the figure and the write-up agree by construction.