

How to generate your Results synthesis
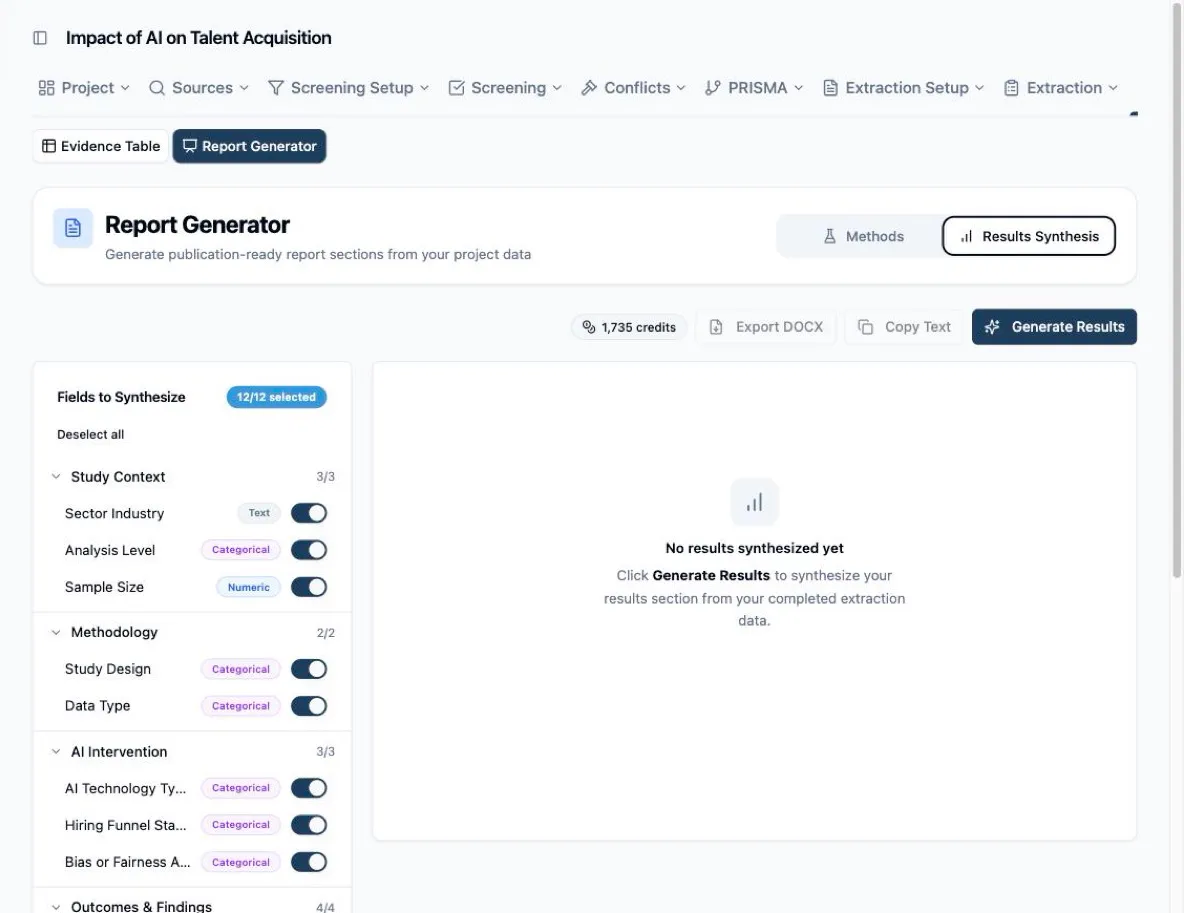
Where the Methods draft describes how you ran the review, the Results synthesis reports what you found: a narrative built from the answers your extractors recorded, organised into themes, with the numbers computed from the data rather than written by a model. It lives beside the Methods draft — Results → Report Generator, then the Results Synthesis tab.
Before you can run it
Section titled “Before you can run it”Results synthesis reads completed extractions, so it needs two things your project may not have yet, and the Generate Results button tells you which is missing: a published extraction template, and at least one paper with extraction finished. Until then the preview panel points you to the template builder or the extraction queue.
Papers count as finished the same way they do in the evidence table — validated, or submitted where no verifier was paired. Everything still in progress simply isn’t in the synthesis.
Choose what gets synthesized
Section titled “Choose what gets synthesized”Fields to Synthesize lists your template, section by section, with a toggle on every field and a badge for how it will be handled:
- Categorical fields (dropdown, multi-select, yes/no) are reported as distributions — the dominant categories and what the spread means.
- Numeric fields get central tendency, spread, and outliers, using the unit you defined.
- Text fields are read for themes: convergences, divergences, and the patterns that recur across studies.
All fields start selected. Turn off the ones that don’t belong in a Results section — internal bookkeeping fields, reviewer notes, anything you extracted for your own tracking — and the draft narrows accordingly. Synthesis Notes underneath is for steering: what to emphasise, which comparisons matter. Click Save settings to keep both.
What comes back
Section titled “What comes back”The draft opens with a Study Characteristics section describing the corpus — how many studies, the publication-year range and the trend across it, and the sources that recur most — followed by two compact tables built directly from your data: publication years, and most frequent publication sources. Those tables are computed, not written, so their numbers are exact.
After that come thematic sections drawn from your selected fields. The subheadings name themes (“Study Designs and Data Collection”), not your field labels, and each one weaves several related fields together rather than marching through them one at a time.
Claims that come from your text fields carry numbered citations — [1], [2] — pointing into a References list at the end, built from the actual papers those themes were drawn from and holding only the studies that were cited. Statistics and the Study Characteristics section carry no citations, because they describe the corpus rather than any particular study.
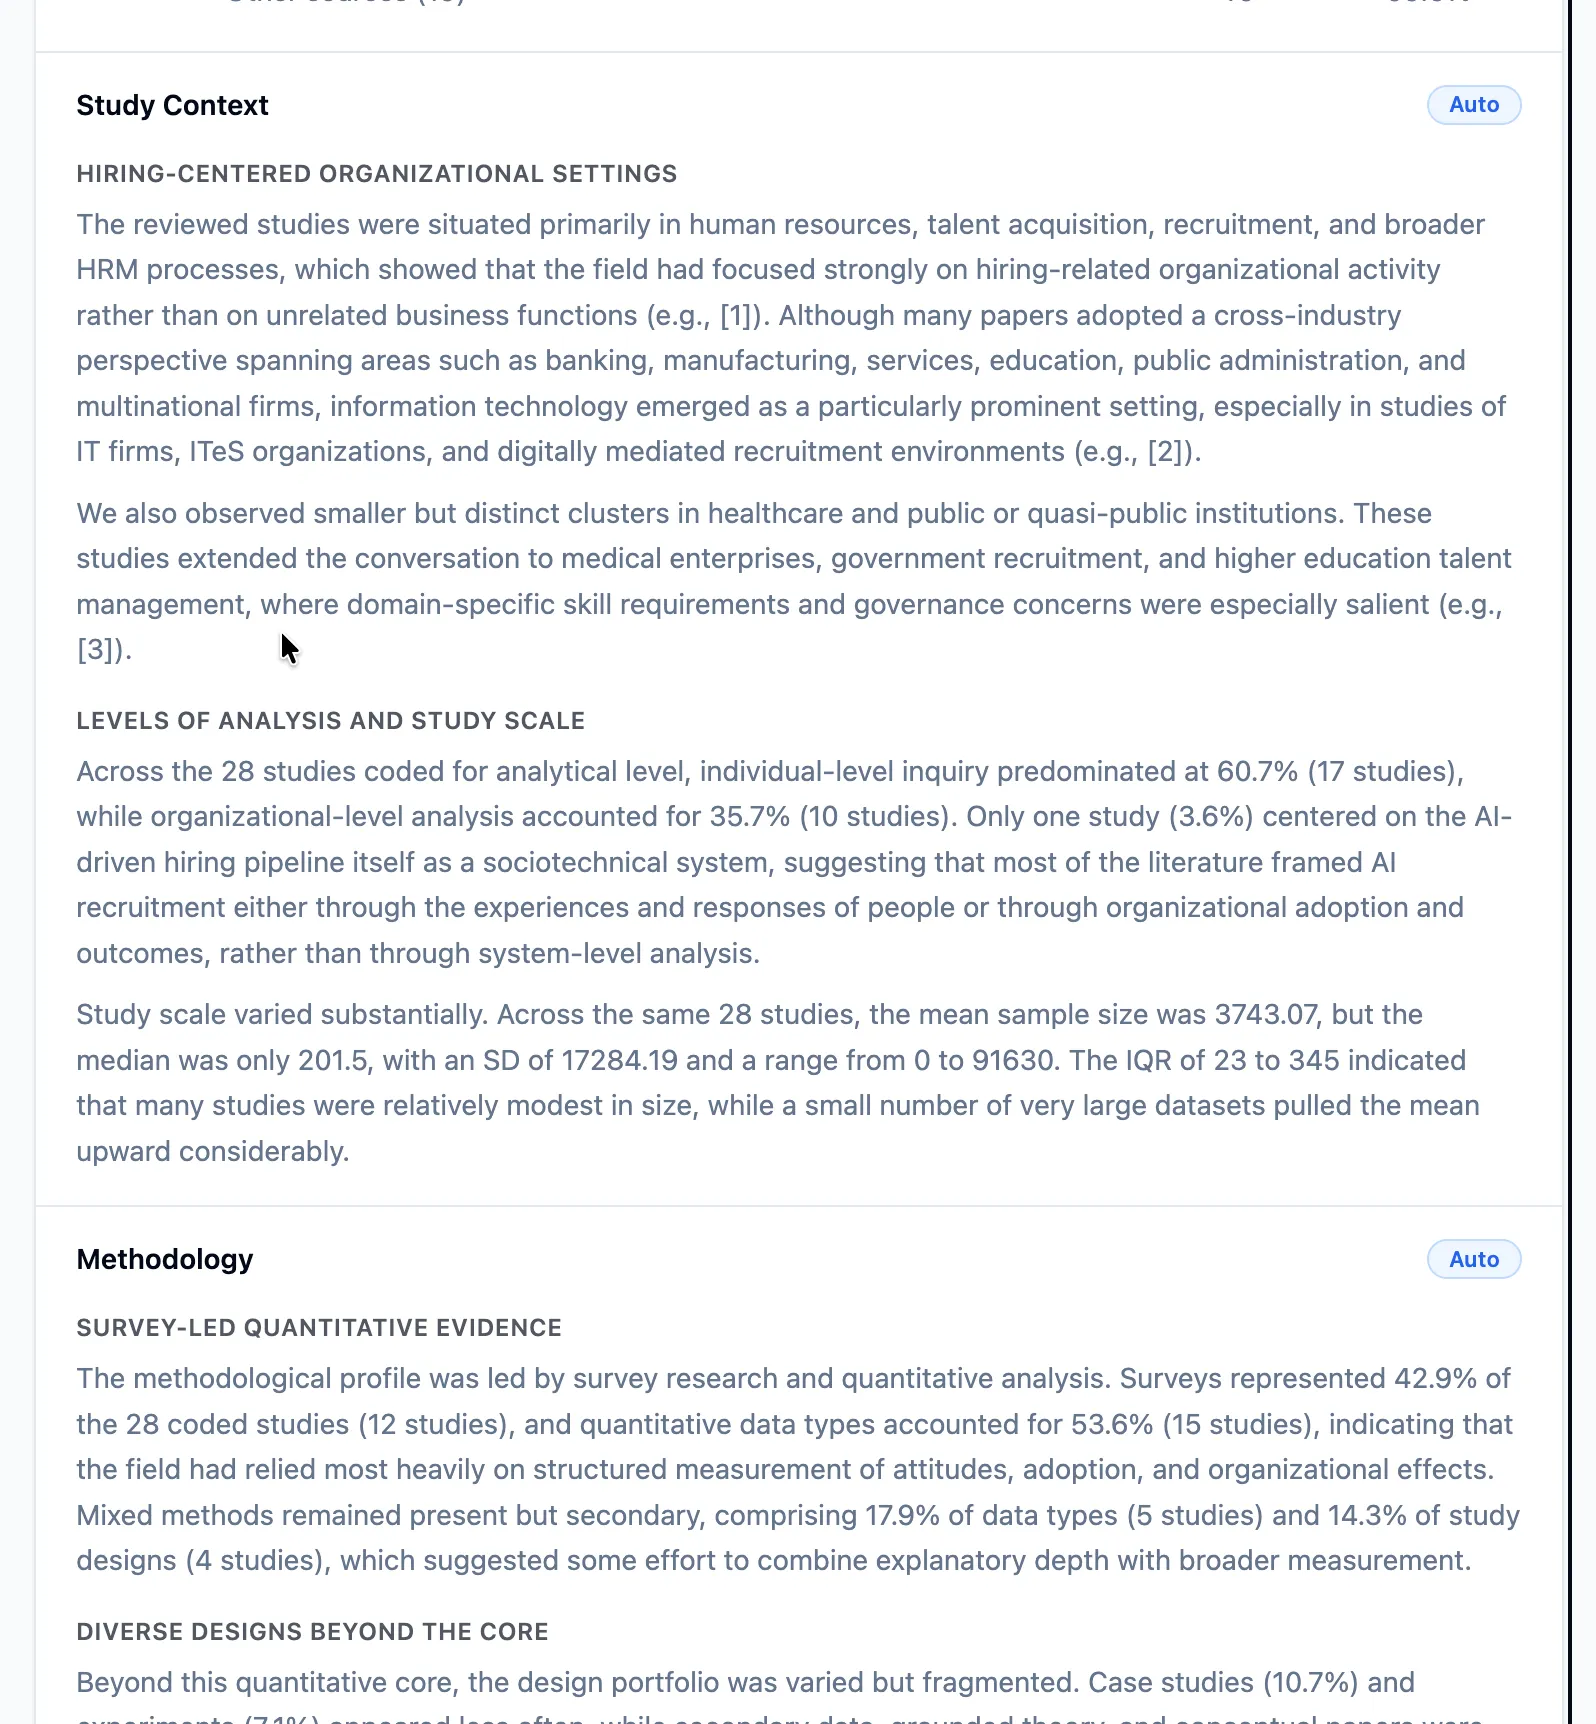
Above the draft sits a data coverage note, and it’s the line to read before you quote anything: it states how many of your included studies had extracted data, and how many of those the themes actually cover. When extraction is incomplete, the note says so plainly — findings can only draw on extracted data, and the draft is written not to blur that distinction.
Run it
Section titled “Run it”-
Set your field toggles and synthesis notes, then click Generate Results.
-
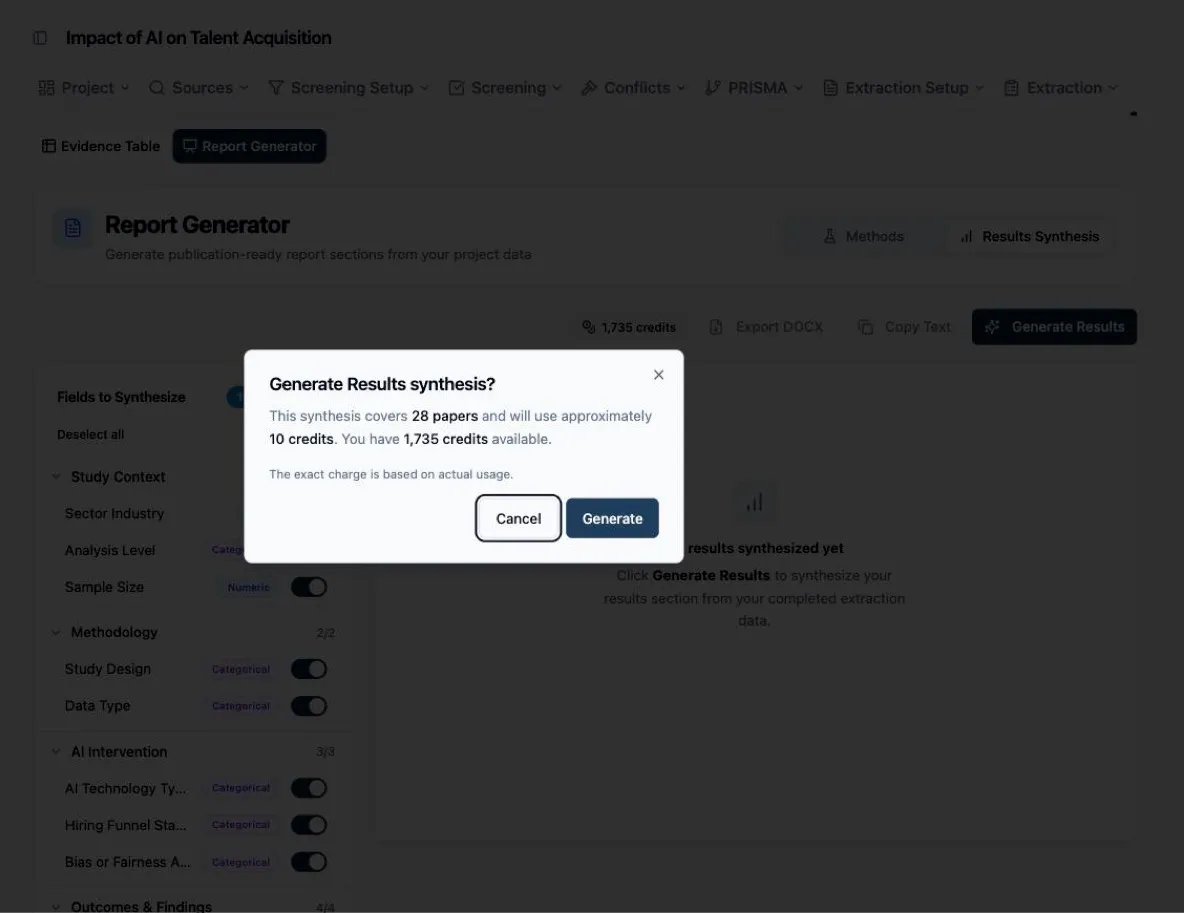
Confirm the estimate. Because a synthesis reads every extracted paper, it’s the one AI feature in Littview that asks first: a dialog shows how many papers are covered and roughly how many credits the run will use, against your balance. Cancel costs nothing.
-
Leave if you want. The run continues on the server — a banner tracks the elapsed time, and if you navigate away or close the tab it still finishes and updates the section. You’ll get a notification when the report is ready.
Change your fields or notes afterwards and a banner reminds you the draft predates them; Regenerate rewrites it. Export DOCX and Copy Text work exactly as they do for Methods, and both carry the tables and the reference list with them.